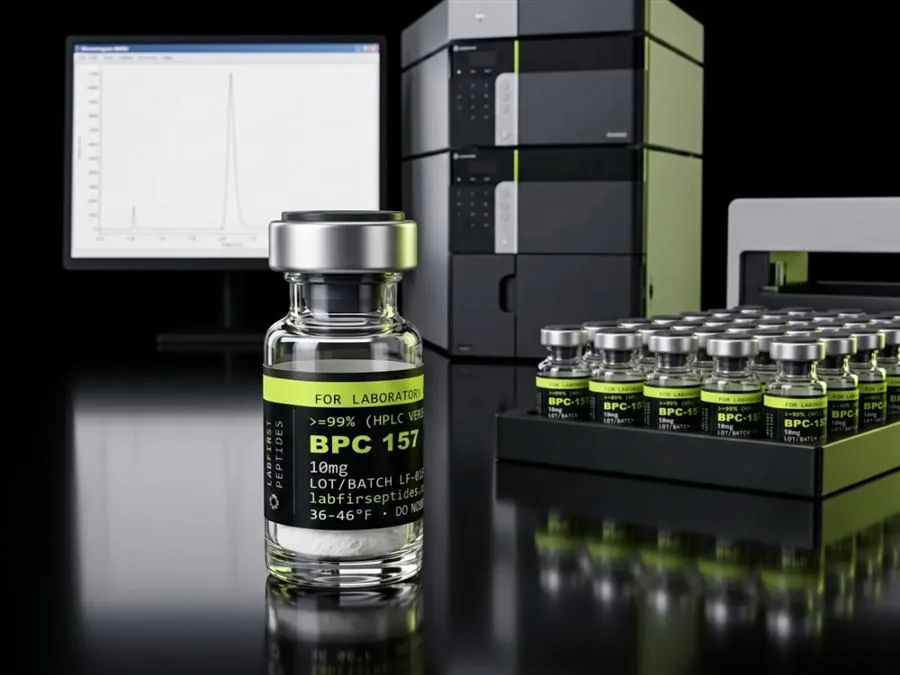
Peptide purity testing is almost always reversed-phase HPLC with UV detection: the peptide peak area as a percentage of everything the detector saw. So a high purity peptide, even the purest one on offer, has only a high chromatographic figure. It does not establish identity, net peptide content, or safety, each of which needs its own method.
- Peptide purity is nearly always an RP-HPLC area percentage: the main peak's share of total detected peak area at one wavelength.
- Area percent excludes water, salts, and the TFA counterion, none of which absorb at the detection wavelength, so purity is not a statement about mass.
- A purity result does not establish identity; mass spectrometry does, and a clean chromatogram of the wrong compound reads exactly like the right one.
- Net peptide content, measured by amino acid analysis, commonly runs 70% to 90% of gross mass and is the number solution-preparation arithmetic should start from.
- A certificate can be authenticated by asking the named issuing laboratory whether it issued the report; a document with no lot number or laboratory name cannot be verified at all.
What this guide covers
This guide covers what a peptide purity figure measures, what it misses, and how to read and check the certificate it sits on. Think of it like a class photo where you measure how much of the picture is the one student you came for. The purity number tells you how big that share is. It does not tell you who the student is, or how much of the vial is peptide at all.
When a supplier quotes 98% purity for a peptide, the number almost always comes from one experiment: reversed-phase high-performance liquid chromatography with ultraviolet detection, RP-HPLC for short. The sample is dissolved, pushed through a column that separates molecules by hydrophobicity, and watched by a UV detector as the separated components come off. Each component appears as a peak. The purity figure is the main peak's area divided by the total area of every peak the detector recorded, expressed as a percentage.
That definition carries all the caveats that matter. It is an area percentage, computed at one detection wavelength, over the components that both left the column and absorbed the light. It is not a statement that 98% of the powder's mass is peptide. The distinction sounds pedantic until it changes an experiment, which it does the first time solution-preparation arithmetic is run from the label instead of from the certificate.
The method itself is standard and sound. RP-HPLC is the workhorse of peptide analysis for good reason: it separates closely related sequences well, including the deletion and truncation products that solid-phase synthesis leaves behind, and its conventions are anchored in the compendial chromatography chapter rather than in anyone's marketing. The number is honest about what it measures. Reading more into it than it measures is where certificates get misread.
- Chromatographic purity — RP-HPLC area percent at one wavelength
- Identity — observed mass against theoretical, by mass spectrometry
- Net peptide content — amino acid analysis or nitrogen determination
- Water and counterion — Karl Fischer titration, ion chromatography
- Authenticity — the issuing laboratory, checked by lot number
What does the UV detector miss?
UV detection for peptides is usually run near 214 nm, where the amide bonds of the peptide backbone absorb. That choice makes the method sensitive to anything peptide-shaped, which is exactly what you want when the likely impurities are failed sequences from the same synthesis. It also defines the method's blind spots.
Water does not absorb there. Neither do the inorganic salts left over from purification, nor the trifluoroacetate counterion that most synthetic peptides carry after purification in TFA-containing buffers. All of that mass is real, sits in the vial, and appears nowhere in the purity figure. A lyophilized peptide reported at 99% purity can still be a quarter water and counterion by weight without either number being wrong.
Co-elution is the second blind spot. Two molecules that leave the column at the same time appear as one peak, and an impurity hiding under the main peak gets counted as product. Good methods minimize this with shallow gradients and adequate run times, and orthogonal conditions catch what one column misses, which is why a thorough impurity workup runs more than one method. A single-injection, single-wavelength area percent is a reasonable summary statistic. It is not an impurity profile, and pharmaceutical impurity work, which follows the ICH threshold framework, treats it as a starting point rather than a conclusion.
What does each claim on a certificate rest on?
The certificate of analysis for a research peptide is a set of separate claims, each earned by a different measurement. Collapsing them into the single word purity is the most common reading error in the trade.
| Claim | Method | What it establishes | What it cannot establish |
|---|---|---|---|
| Chromatographic purity | RP-HPLC with UV detection | The main peak's share of detected peak area | Identity, mass content, invisible impurities |
| Identity | Mass spectrometry (LC-MS or MALDI) | Observed mass matches the theoretical mass | Purity; full sequence order in routine work |
| Net peptide content | Amino acid analysis or nitrogen determination | The fraction of gross mass that is peptide | Which peptide it is |
| Water content | Karl Fischer titration | Residual moisture in the solid | Anything about the peptide itself |
| Counterion content | Ion chromatography | TFA or acetate fraction of gross mass | Peptide quality |
| Endotoxin | LAL assay | Bacterial endotoxin level in the lot | Sterility, chemical purity |
A certificate that reports only the first row is incomplete. For inexpensive catalog material, incomplete is normal. What matters is knowing which rows are present before treating the material as characterized. The most consequential pairing is the first two. A purity figure without a mass spec result is a clean chromatogram of an unconfirmed compound: RP-HPLC will happily report 99% for the wrong peptide, because the method measures how uniform the sample is and says nothing about what the uniform thing is.
How does net peptide content change the arithmetic?
Gross vial mass and peptide mass are different quantities. A lyophilized solid carries bound water, the counterion from purification, and sometimes residual salts, and together these commonly put net peptide content anywhere from about 70% to 90% of gross mass for research material. Amino acid analysis is the reference method for measuring it; elemental nitrogen determination is the cheaper proxy.
The arithmetic consequence is direct. A vial labeled 10 mg with a net peptide content of 80% holds 8 mg of peptide. Brought into 2 mL of diluent:
10 mg × 0.80 = 8 mg
8 mg ÷ 2 mL = 4 mg/mL
against the 5 mg/mL the label arithmetic suggests. Whether that 20% gap matters depends entirely on the work. What a laboratory cannot do is claim the gap does not exist because the certificate said 99% pure. Both numbers are correct. They answer different questions.
The same distinction reprices material. Two vials at the same nominal milligrams and the same price differ in value when their net contents differ, and suppliers do not advertise the difference. The cost-per-milligram tool compares list prices on gross mass; where a certificate states net peptide content, the honest comparison divides by that first. The vial concentration calculator handles the solution arithmetic for other vial sizes and volumes.
How do you read a purity report, step by step?
A certificate is read in about two minutes once you know where to look. Work through the fields that carry weight in this order:
- The lot number. It ties the document to a specific batch, and a certificate without one describes nothing in particular.
- The compound name, with a sequence or molecular formula and a theoretical mass.
- The mass spec result, stated as an observed value beside that theoretical value. The two should agree within the instrument's tolerance, typically around a dalton for routine electrospray work.
- The chromatogram itself, as an image with an integration table rather than a bare summary percentage.
- The method conditions: column, gradient, detection wavelength, run time.
- The test date, and the name of the laboratory that ran the analysis.
Absences are informative. A stated purity with no chromatogram cannot be checked even casually. Missing method conditions mean the number cannot be reproduced.
Red flags on a certificate
Some patterns recur on low-end documents often enough to treat as flags:
- purity quoted to implausible precision for a routine method;
- the identical chromatogram image appearing across different lots or different compounds;
- observed and theoretical masses that match to too many decimal places;
- a test date later than the ship date;
- a document with no laboratory name anywhere on it.
None of these alone proves fabrication. Together with a supplier's reluctance to discuss them, they price the documentation at what it costs to print.
How do you verify a certificate with the laboratory?
The strongest check available to a buyer costs one email. Independent analytical laboratories keep records of the reports they issue, and most will confirm, given a report number or lot number, whether a document originated with them. They will not release another client's data, and they do not need to. The question is whether the certificate is real, and the laboratory that issued it is the only party who can answer.
The check works only when the certificate names a third-party laboratory in the first place. An in-house certificate still tells you something, and for routine catalog material it is the norm. It is also a self-graded exam, and its value depends on the supplier's wider documentation practice. A supplier who states which claims are tested in-house and which are verified externally, and who will name the external laboratory when asked, is showing the shape of a working quality system. One who declines to say who ran the analysis is asking for the document to be taken on faith. Our own testing and documentation practice is laid out in the quality standard.
FOR LABORATORY AND IN-VITRO RESEARCH USE ONLY. NOT FOR HUMAN OR ANIMAL CONSUMPTION. NOT FOR PERSONAL, MEDICAL, DIAGNOSTIC, THERAPEUTIC, OR RECREATIONAL USE.
Why does the test date matter?
A purity result is a snapshot of the lot on the day of analysis. It does not follow the vial. Every degradation route that operates in storage, hydrolysis, oxidation, aggregation, moves material out of the main peak and into new ones, so a certificate from January describes January. The gap between the test date and the day the material is measured again is a variable the certificate cannot speak to.
This is why the test date belongs on the document, and why handling records matter as much as the starting figure. A lot stored sealed, cold, dark and dry will track its certificate closely for a long time. One opened cold into humid air, repeatedly, will not, and no document announces the difference. The storage and stability guide covers what moves the number and how a laboratory keeps its own record of the conditions. A certificate establishes where a lot started. The laboratory's log establishes where it has been since.
Bottom line
A purity figure is the main peak's share of detected UV area in one HPLC run on one date. It says nothing about identity or how much of the vial is peptide. Read it beside a mass spec result, a net content figure, the method and the test date, and confirm third-party reports with the laboratory that issued them.
Common questions
Is 99% peptide purity good?
Does purity tell me how much peptide is in the vial?
How can a certificate of analysis be verified?
What method is used for peptide purity testing?
What is net peptide content and how does it differ from purity?
More documentation guides
Sources
- USP General Chapter <621>, Chromatography. Compendial foundation for chromatographic procedures, system suitability, and the peak-area conventions that area-percent purity reporting rests on.
- ICH Q3A, Impurities in New Drug Substances. The threshold framework for reporting, identifying, and qualifying impurities in pharmaceutical work; cited as the standard a full impurity profile is judged against, not as a requirement on research material.
- Accurate quantitation of standard peptides used for quantitative proteomics. Proteomics . Basis for the amino acid analysis discussion — this paper covers using hydrolysis and amino acid quantitation to establish how much peptide a preparation actually contains.